Download IVISION Catalog

 01
Define the question and metric
Agree the operating outcome and required inputs.


Visible activity, waiting and cycle intervals can contribute to an efficiency discussion. Confirm how each observation is measured and combine it with output, quality and planned-time records rather than presenting camera activity as a complete performance score.
Confirm detector support, camera suitability and the proposed event workflow before deployment.
Define an efficiency review

 Without IVISIONStandard CCTV feed
 With IVISIONIllustrative event overlay
The Process
Define the metric before interpreting the camera data Help teams investigate a specific operational efficiency question with bounded evidence.
01Agree the operating outcome and required inputs.
 02
Check counts, intervals and coverage against representative references.
 03
Include planned time, output and quality evidence as appropriate.
 04
Engineers evaluate explanations and measure any proposed improvement.
Explore Your Options
| Dimension |  Operational-efficiency analysis |  Production-cycle monitoring |
|---|---|---|
| Observation |  Validated visible activity, intervals or checkpoint counts. | A pair of supported visible events marking a cycle boundary. |
| Event criteria | A reviewer compares the observations with defined operational inputs. | The validated end event follows the corresponding start event. |
| Monitoring setup | Specify the metric, denominator, exclusions and comparison conditions. | Agree cycle definition, interrupted cycles and timestamp handling. |
| What it cannot establish | Camera activity alone does not establish OEE, ROI, labor productivity or causation. | A visual interval may differ from machine cycle time and does not establish worker productivity. |
| Practical outcome | Help teams investigate a specific operational efficiency question with bounded evidence. | Help teams compare observed cycle intervals under defined conditions. |
Illustrative demonstration
Example footage and simulated events explain the review workflow. They do not measure detector performance.
 Sites overview
No matching events.
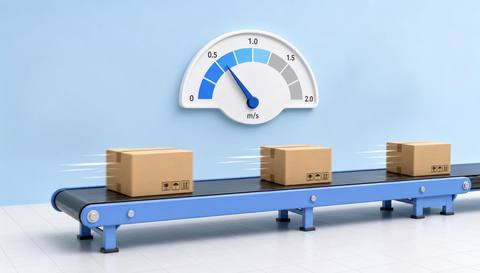
 Production Monitoring
Provide a defined visible timing input.
Read More
 Production Monitoring
Review validated checkpoint cadence.
Read More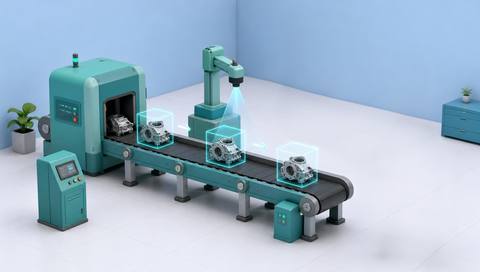 Production Monitoring
Investigate the specific process question behind a metric.
Read MoreEXPLORE WHAT’S POSSIBLE
01 / 04 · OPERATIONAL-EFFICIENCY ANALYSIS
Teams want to understand variation between runs.
Example event: Validated visible intervals differ across comparable periods.
Operator response: Check mix, interruptions and process records.
Practical value: Support a grounded improvement discussion.
Discuss this capability02 / 04 · OPERATIONAL-EFFICIENCY ANALYSIS
Observed pace differs from the planned rate.
Example event: Validated crossing data shows a cadence change.
Operator response: Review downtime and quality records before interpretation.
Practical value: Clarify which input changed.
Discuss this capability03 / 04 · OPERATIONAL-EFFICIENCY ANALYSIS
Waiting appears to consume part of the run.
Example event: Retained observations show visible waiting intervals.
Operator response: Compare with planned buffering and demand.
Practical value: Help evaluate a specific process hypothesis.
Discuss this capability04 / 04 · OPERATIONAL-EFFICIENCY ANALYSIS
Cover the process points relevant to the chosen metric.
Visibility: Unseen work and missing periods create incomplete evidence.
Configuration: Validate each input and any calculation or record integration.
Privacy: Do not rank workers from isolated activity observations.
Human review: Responsible analysts verify denominators and operating context.
Discuss this capabilityFrequently asked questions
Interpret validated visible activity and timing observations alongside production inputs and records.
Not without verified availability, performance and quality inputs and a validated calculation.
No. Savings depend on measured changes and the actual operating context.
Not necessarily; waiting may be planned, necessary or caused by unseen work.
Only with appropriate controls for product mix, conditions and record completeness.
Find your fit
Help teams investigate a specific operational efficiency question with bounded evidence. For Operations managers, Continuous-improvement engineers.
Workflow to discuss
Operational-efficiency analysis + Define performance questions before collecting evidence.
Discuss a camera view, a monitoring question and the review process your team needs.