Download IVISION Catalog

 01
Prepare the view
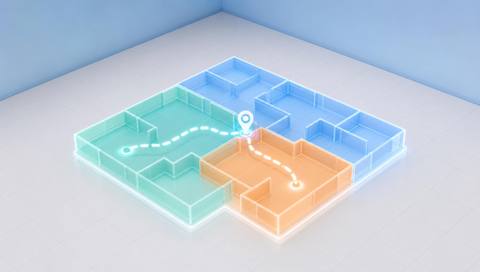
Define area boundaries and what counts as a visit.


Passages, entries and unique visits produce different results. Specify the measure, repeat-visit handling and comparable coverage, then interpret frequency alongside each area’s operational purpose.
Catalog workflow. Confirm detector availability, permitted use and event delivery for the proposed deployment. Website examples are illustrative.
Assess visit-frequency measures
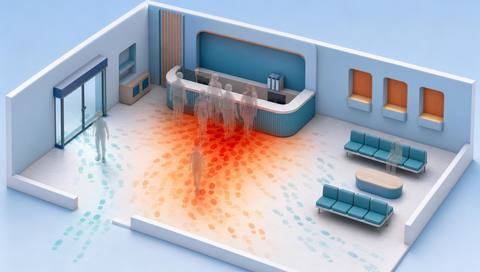
 Without IVISIONStandard CCTV feed
 With IVISIONIllustrative event overlay
The Process
Define a visit before ranking locations Identify areas with recurring demand.
01Define area boundaries and what counts as a visit.
 02
Validate aggregation and repeat-event handling.
 03
Compare equivalent periods and camera coverage.
 04
Check the operational reason before changing resources.
Explore Your Options
| Dimension |  Frequently visited area analysis |  High-traffic and low-traffic area |
|---|---|---|
| Observation |  Repeated qualifying entries or visits to defined areas. | Different movement volumes across monitored regions. |
| Event criteria | Supported aggregation counts the agreed visit event. | Supported aggregation compares the agreed traffic measure. |
| Monitoring setup | Confirm visit definition, repeat handling, period and coverage. | Confirm region size, period, normalization and coverage. |
| What it cannot establish | Cannot establish preference, importance or unique people without additional validation. | Cannot prove unused space, safety or the cause of movement differences. |
| Practical outcome | Help planners identify repeated demand without inferring personal preferences. | Help teams inspect busy routes and apparently quiet regions. |
Illustrative demonstration
Example footage and simulated events explain the review workflow. They do not measure detector performance.
 Sites overview
No matching events.
EXPLORE WHAT’S POSSIBLE
01 / 04 · FREQUENTLY VISITED AREA ANALYSIS
A corridor is busier than a destination room.
Example event: Passage totals dominate a ranking.
Operator response: Separate through-traffic from visits.
Practical value: Improves planning interpretation.
Discuss this capability02 / 04 · FREQUENTLY VISITED AREA ANALYSIS
Repeated staff trips inflate demand.
Example event: One area ranks highly.
Operator response: Check the included population and visit definition.
Practical value: Clarifies customer versus work flow.
Discuss this capability03 / 04 · FREQUENTLY VISITED AREA ANALYSIS
Repeated trips may reflect process needs.
Example event: Visits concentrate in one period.
Operator response: Review supply and task schedules.
Practical value: Supports workflow discussion.
Discuss this capability04 / 04 · FREQUENTLY VISITED AREA ANALYSIS
Cover each compared area consistently.
Visibility: Blind entrances undercount visits.
Configuration: Verify the visit metric and aggregation.
Privacy: Favor aggregate frequency over personal profiling.
Human review: Check purpose and coverage before ranking value.
Discuss this capabilityFrequently asked questions
Ranks areas by a defined aggregate visit measure over a selected period.
No. Necessary routes or tasks can create frequent visits.
Only if a separately validated method establishes that; otherwise they are events.
Yes. Define the included population.
Normalize or use equivalent periods and coverage.
Find your fit
Help planners identify repeated demand without inferring personal preferences. For Space planners, Operations analysts.
Workflow to discuss
Frequently visited area analysis + Define repeat visits consistently.
Discuss a camera view, a monitoring question and the review process your team needs.